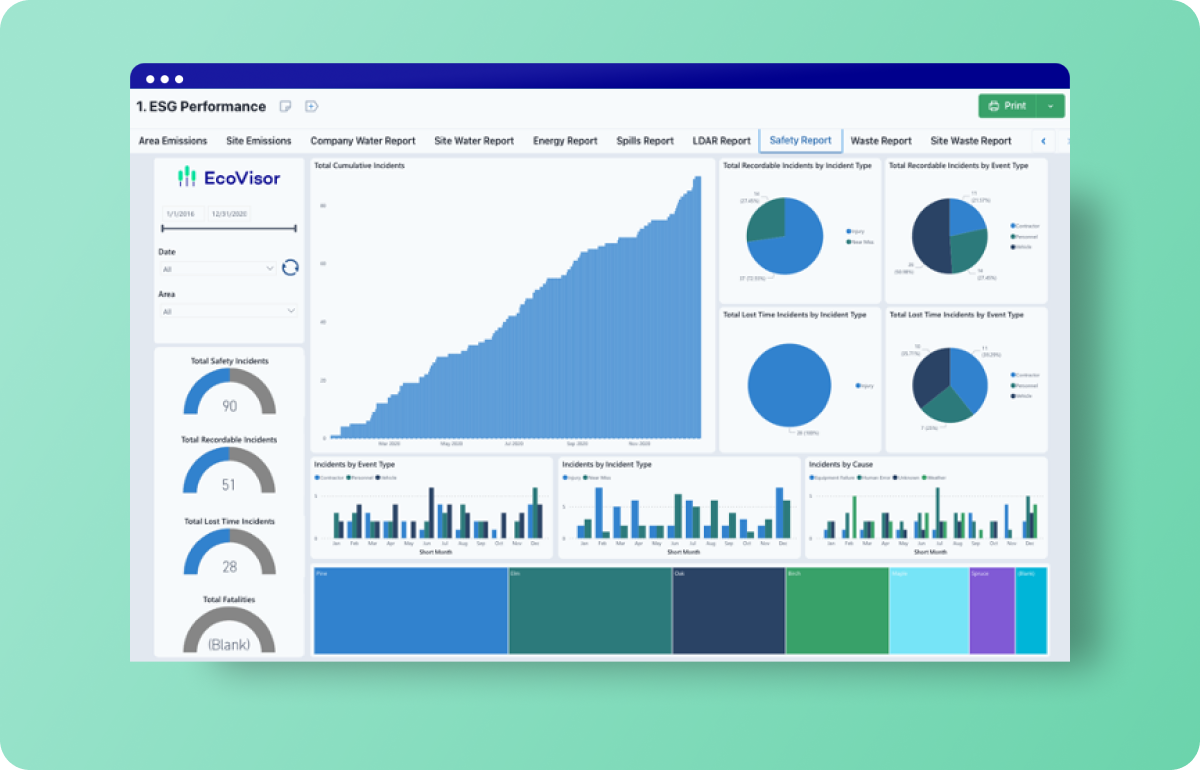
Safety Analytics
EcoVisor is a collaborative analytics platform that captures, connects, validates, and analyzes data so you can set baselines, streamline reporting and track progress.
Move beyond just tracking ESG data. Use EcoVisor to forecast your emissions and evaluate decarbonization pathways.
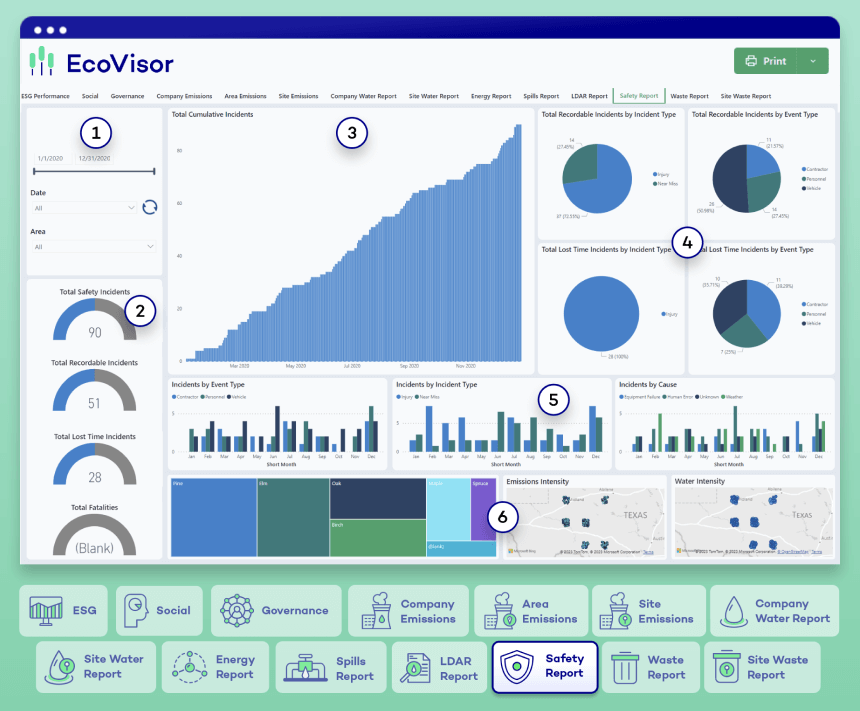
See Safety in Action: Take-A-Tour

Filter safety data by date range and/or area.

Highlight aggregated key safety performance metrics.

Visualize cumulative incidents over time and drilldown in each for specific data.

View TRI & LTI by incident and event type – for both aggregate company data and individual incidents.

View incident data over time by both type and cause.

Map incident data and filter by area.
Dashboard & App Suite
Explore EcoVisor
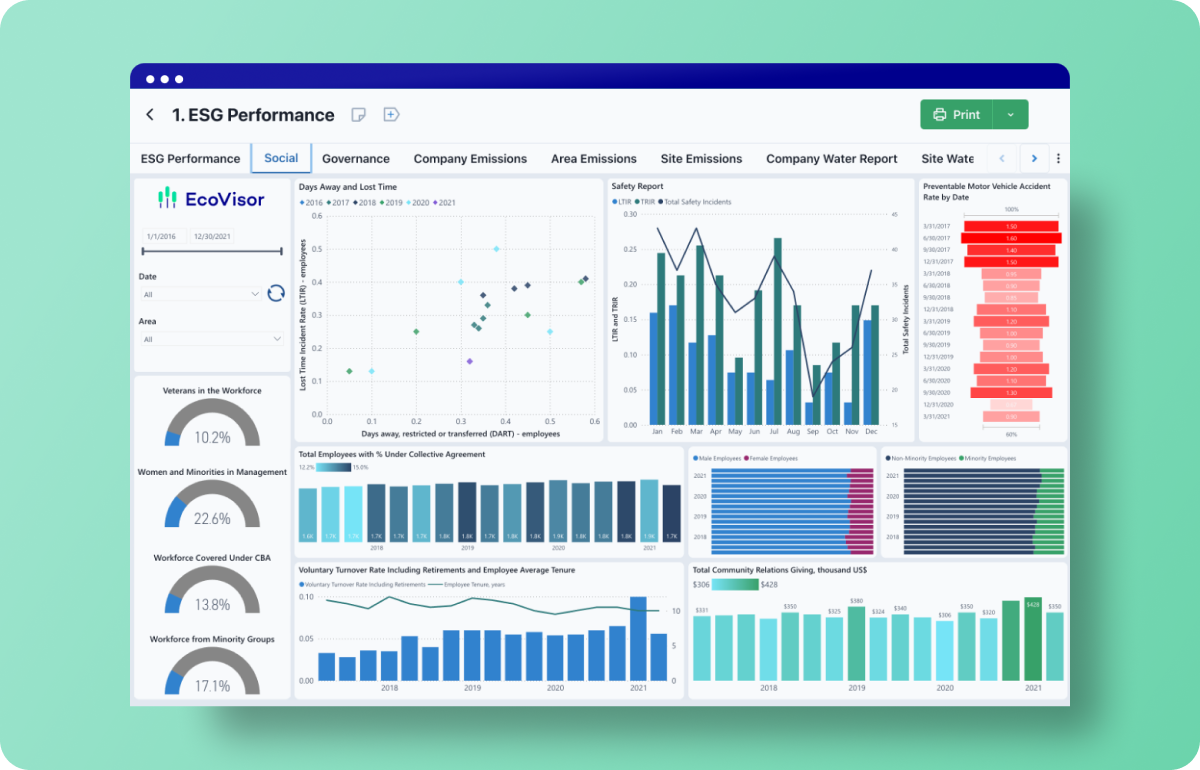
Social
Focusing on the DEI aspects of personnel management, the Social Dashboard is designed for HR, CSR and EHS professionals.
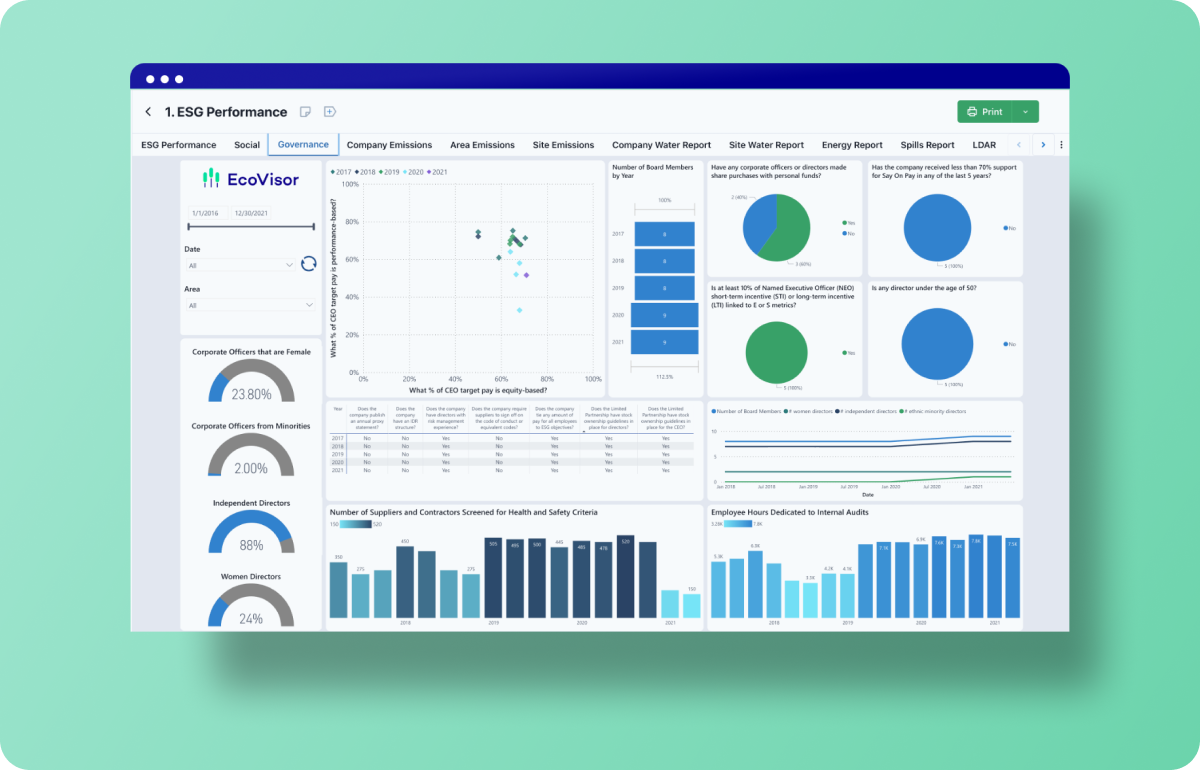
Governance
The Governance Dashboard integrates data related to corporate governance providing oversight of a company’s overall system of direction and control.
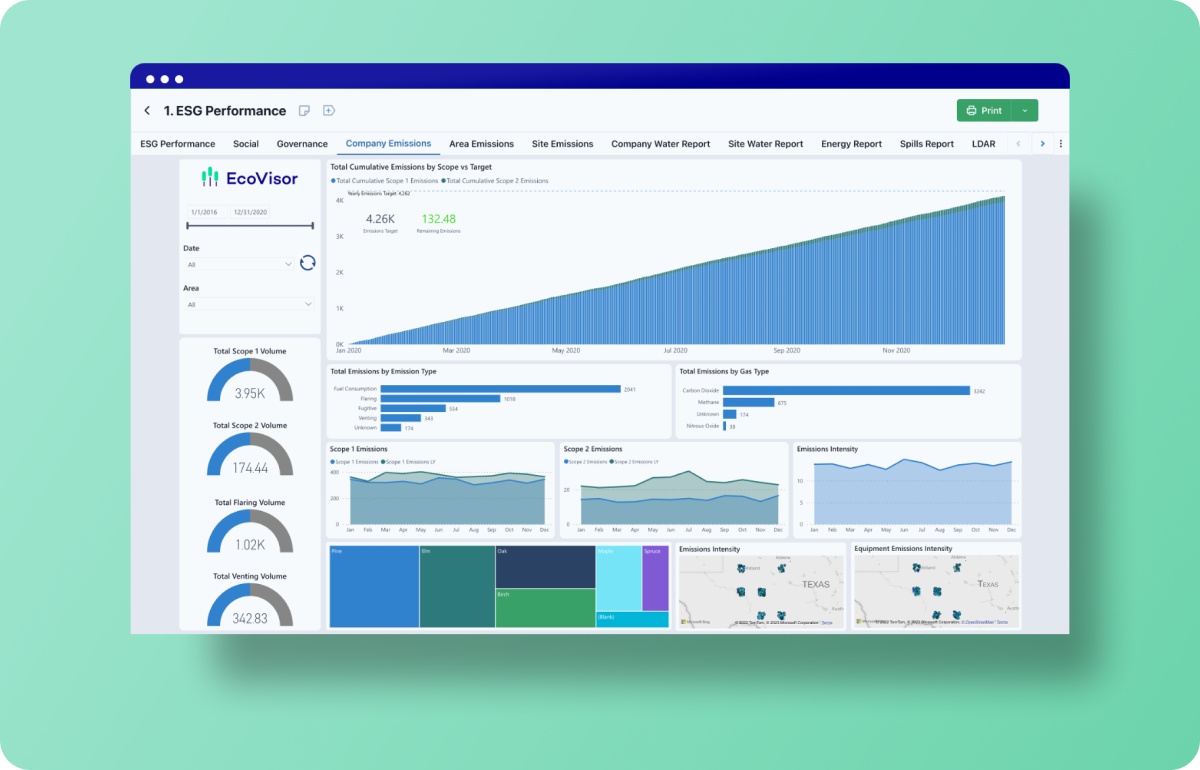
Emissions
EcoVisor’s series of three Emissions Dashboards enable improvement initiatives at the company, area and site levels. Emissions data integrated from multiple disparate data sources can be visualized and analyzed with varying degrees of granularity depending on an individual user’s management scope.
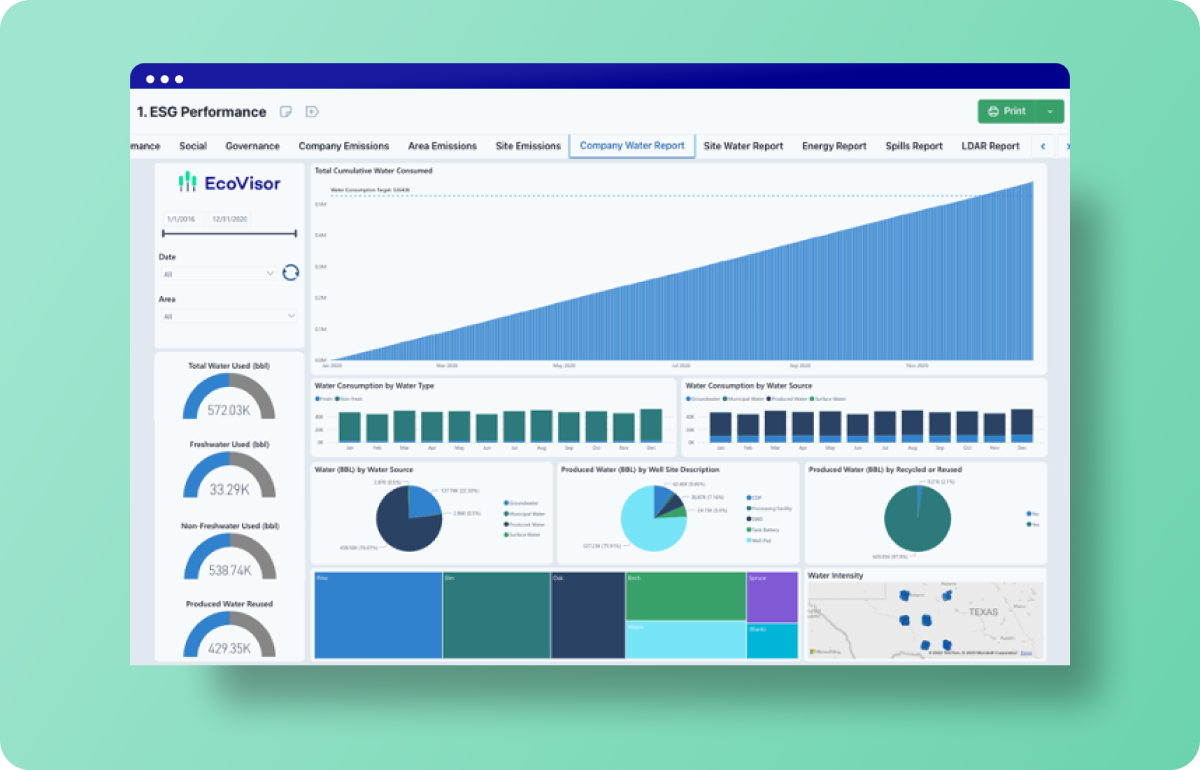
Water
EcoVisor’s two Water Dashboards automatically integrate and visualize data from multiple and disparate sources. This enables water management at the company- wide and operational levels.
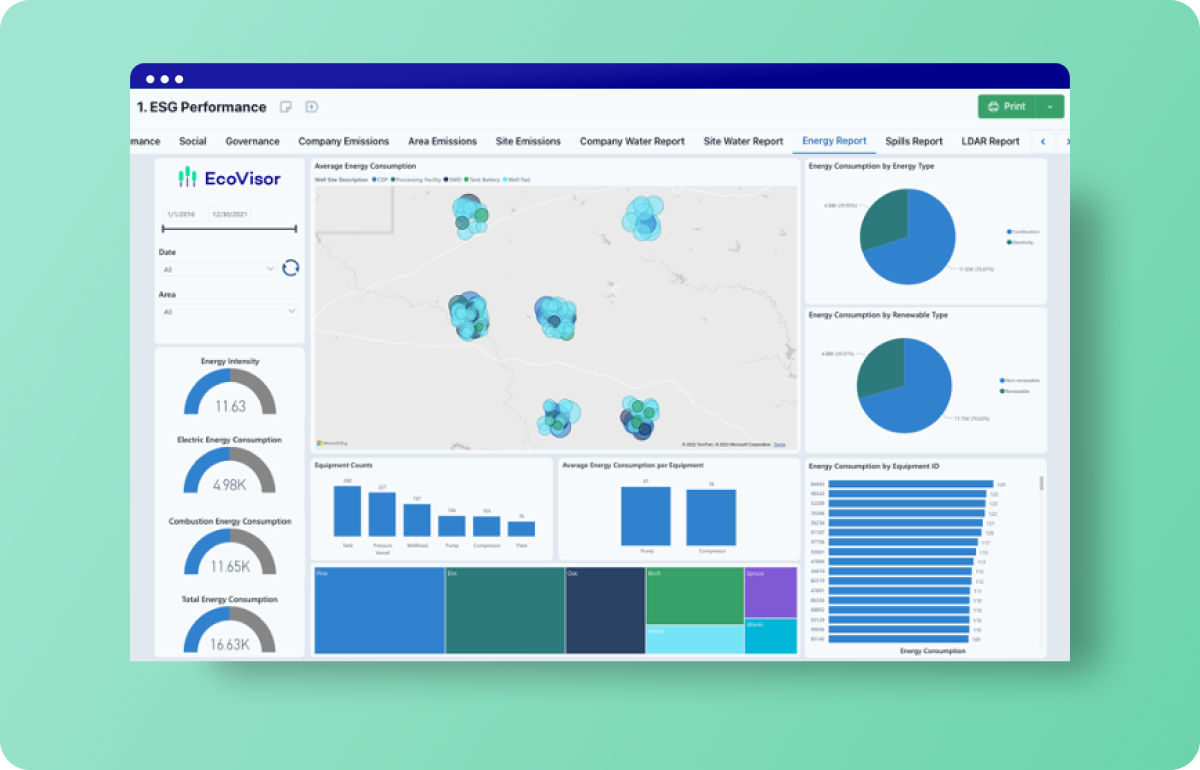
Energy
The EcoVisor Energy Report Dashboard gathers, in one view, data necessary to track and analyze energy consumption. With accurate and automatically updated analytics, ESG professionals and operational teams can collaborate to optimize and reduce overall energy consumption.
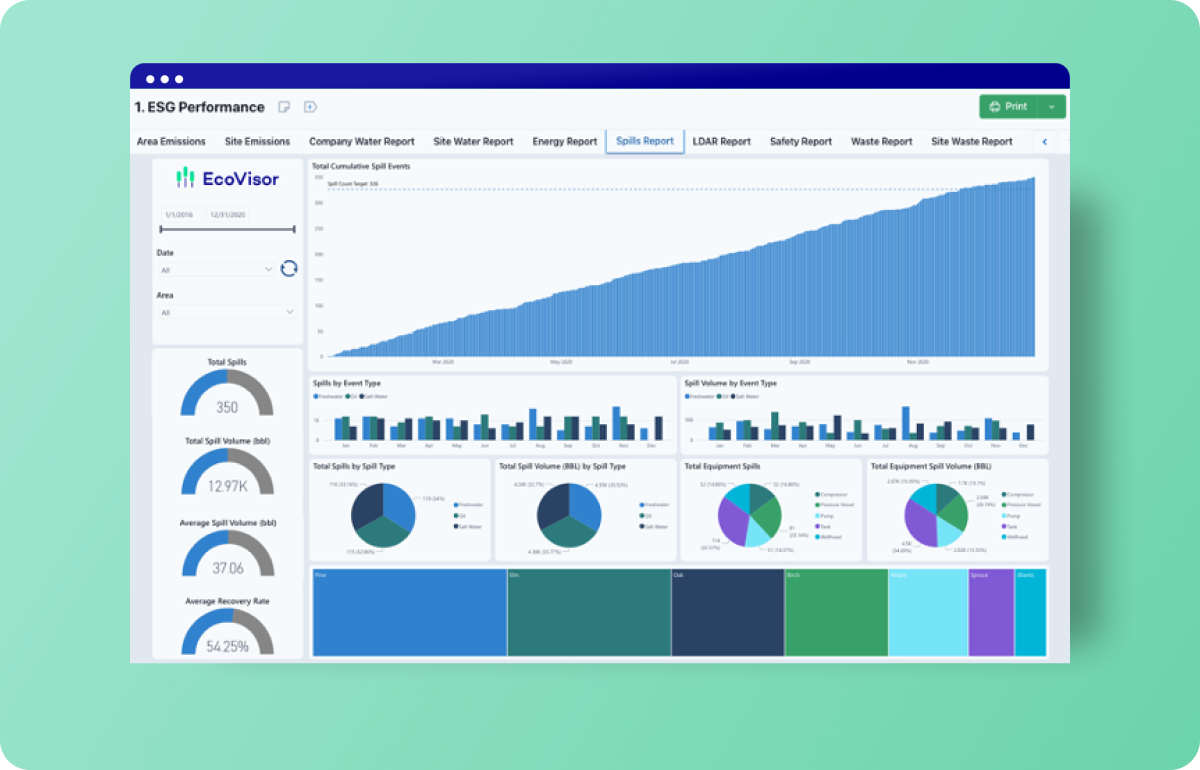
Spills
Understanding spills that have occurred and mitigating risk of recurrence is the role of EcoVisor’s Spills Report Dashboard.
LDAR
EcoVisors Leak Detection and Repair Dashboard provides oversight of a company’s LDAR program. Progress against a defined LDAR survey goal can be monitored along with survey results.
Safety
EcoVisor integrates safety data enabling
a company-wide overview of performance. Data from multiple company systems, as well as external sources, is drawn together in a single interactive view.
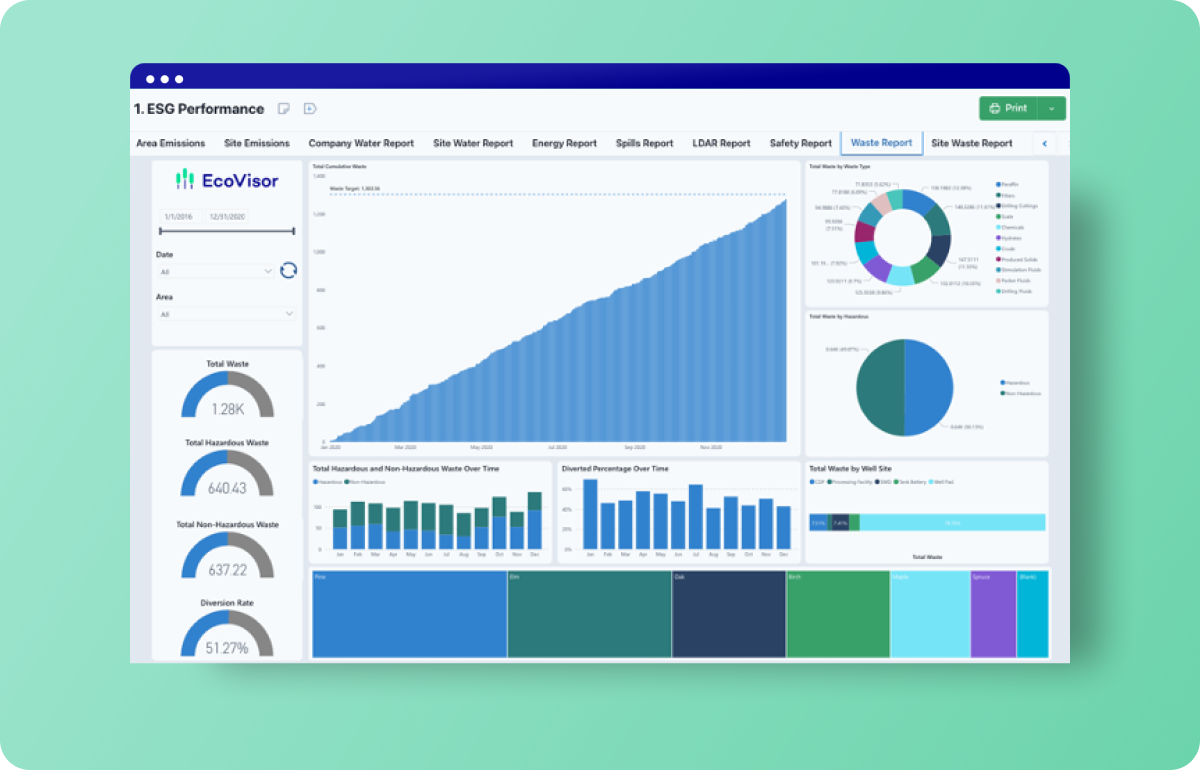
Waste
EcoVisors two Waste Report Dashboards power waste management reporting and improvement decisions.
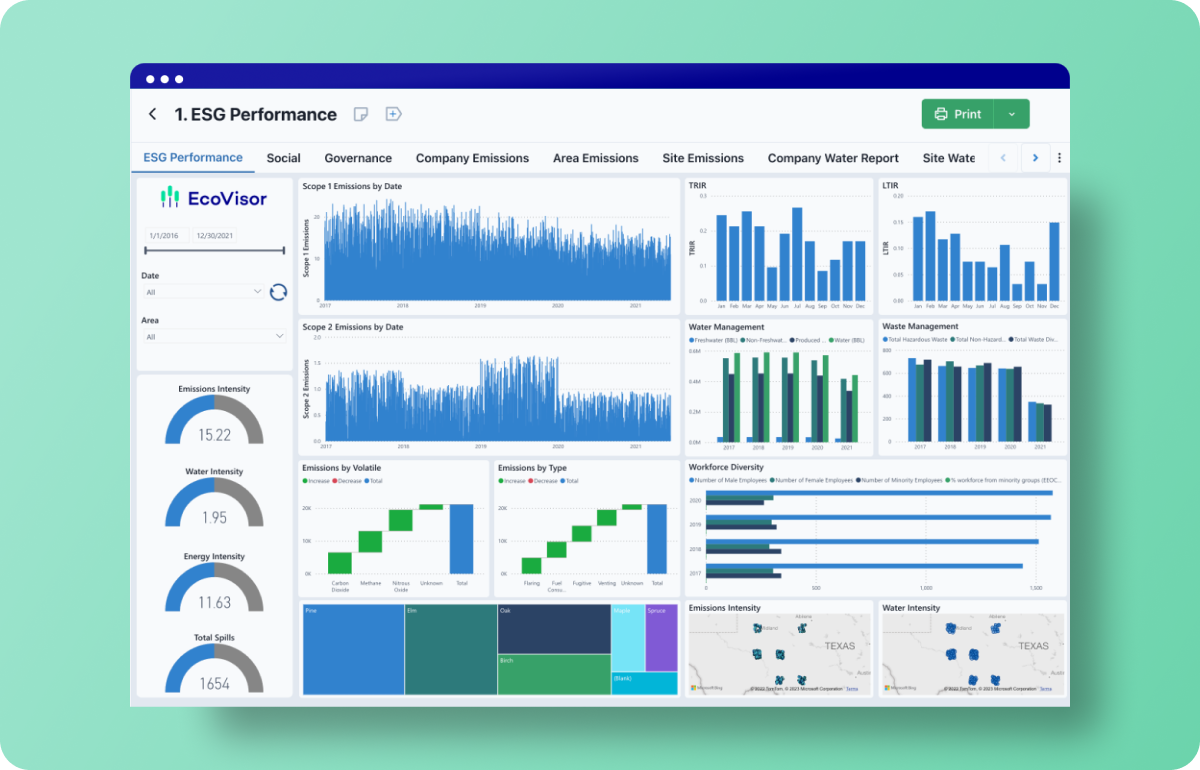
ESG Performance
Designed for executive level oversight, the ESG dashboard automatically integrates multiple disparate ESG data sources.
Ai/ML Powering ESG Decisions
Ai/ML embedded within EcoVisor unifies data, analytics, and knowledge. Disparate source data is left intact. Data is cleansed, centralized and characterized. EcoVisor automatically updates, providing data-driven insights that inform ESG decision-making.
EcoVisor gives permissions-based accessibility to everyone across the whole business enterprise.

The EcoVisor Advantage
EcoVisor is a software-as-a-service (SaaS) platform. Out-of-the-box it amplifies and automates the flow of data and analytics across multiple applications and data sources.
EcoVisor is the only comprehensive and agnostic ESG platform available today. EcoVisor connects disparate data sources using a proprietary data abstraction architecture.
EcoVisor eliminates the need to create time-consuming and costly customized data connections for each source. EcoVisor runs automated, configurable workflows and complex calculations on source-level, granular data.
Rich analytic visuals move your focus from back-ward looking ESG reporting to real-time performance tracking.


Request Info Or Schedule A Platform Tour
Connect with our experts to learn more about the PetroVisor™ and EcoVisor Platforms.