Tour EcoVisor | Connecting Data to Power ESG Decisions
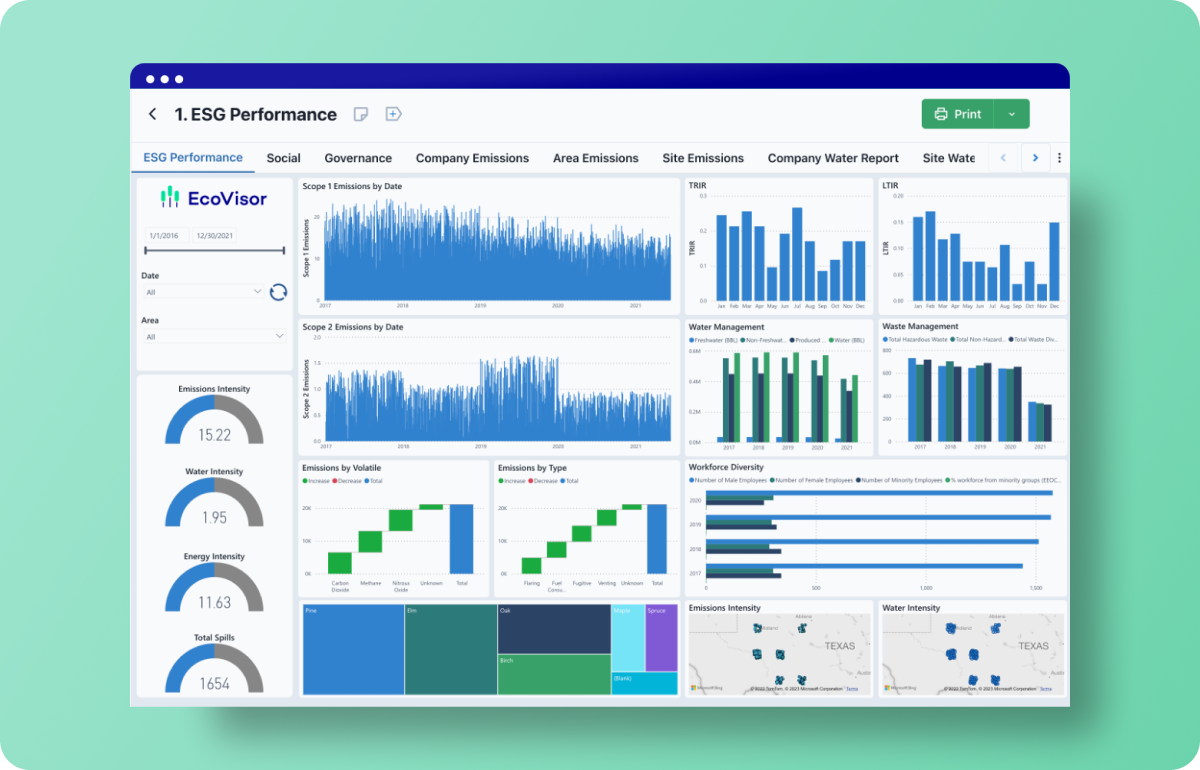
ESG Performance
Executive oversight of all ESG performance integrated in one convenient dashboard.
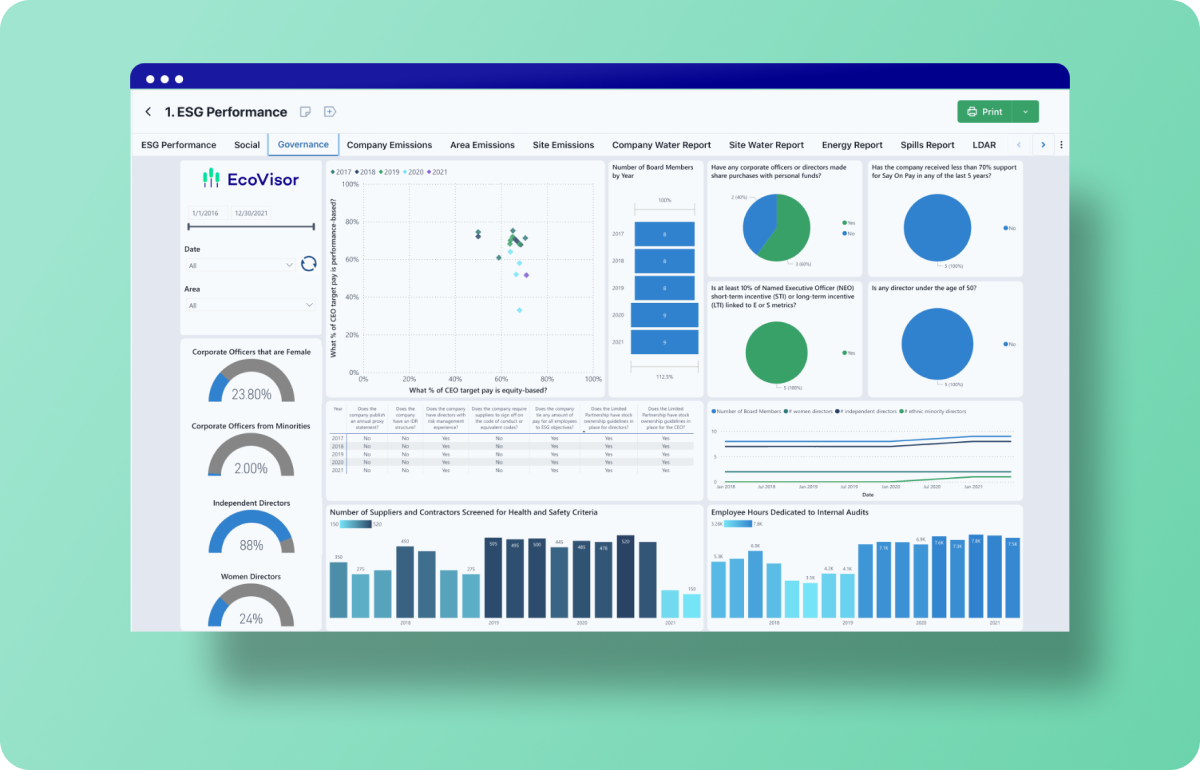
Governance
Automatically collate and visualize key governance data and associated metrics.
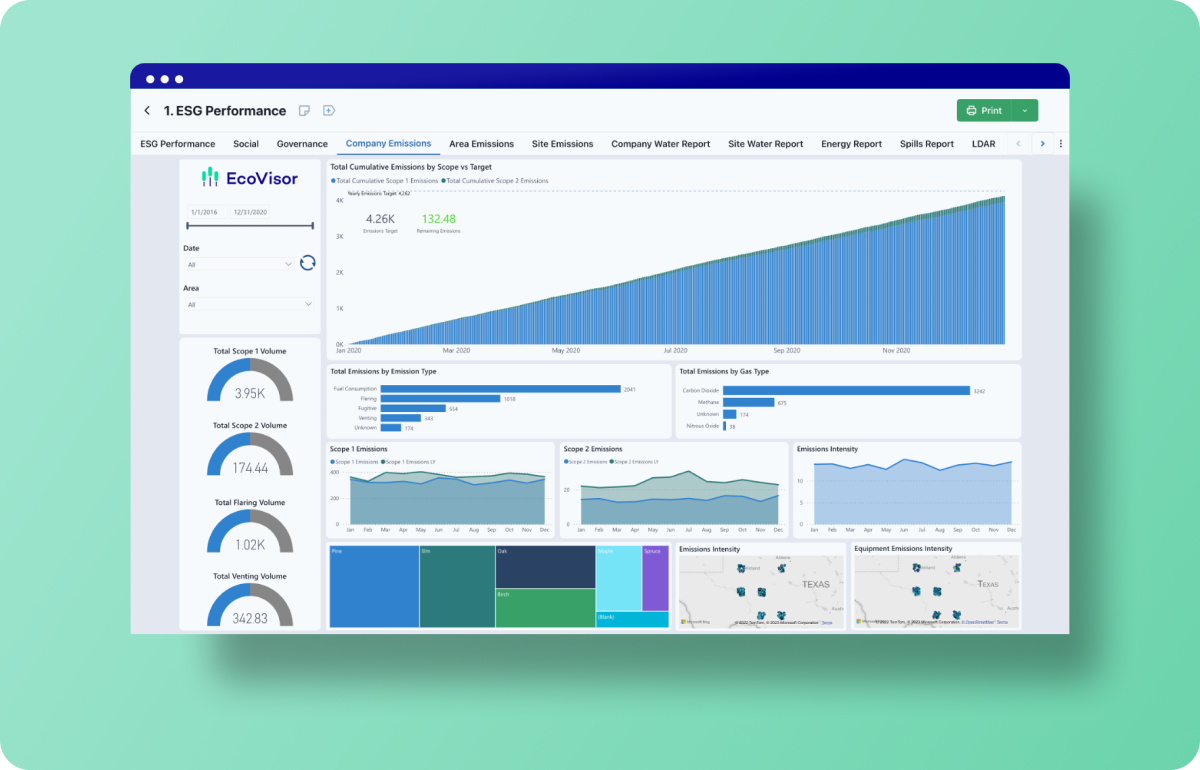
Emissions
Assess emissions data by type at the company, area, and site levels right down to individual device emissions.
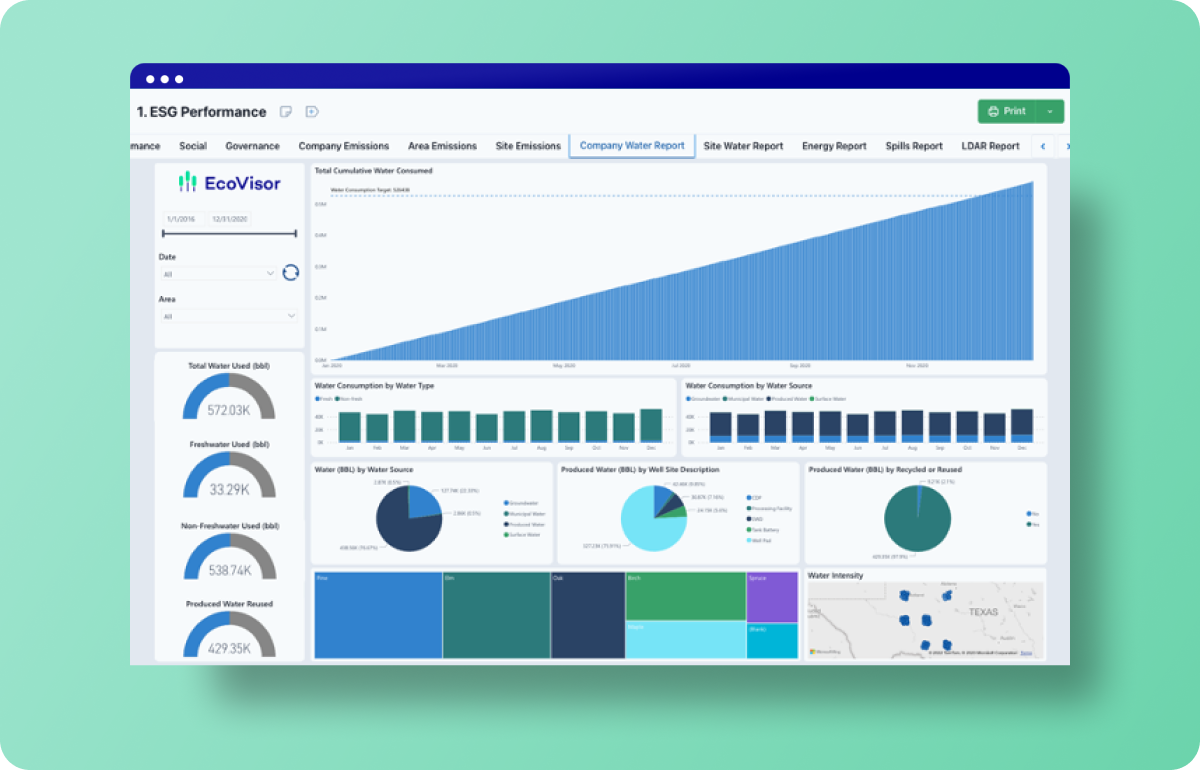
Water
Track water production and/or consumption at the company and site level including recycling and overall water intensity.
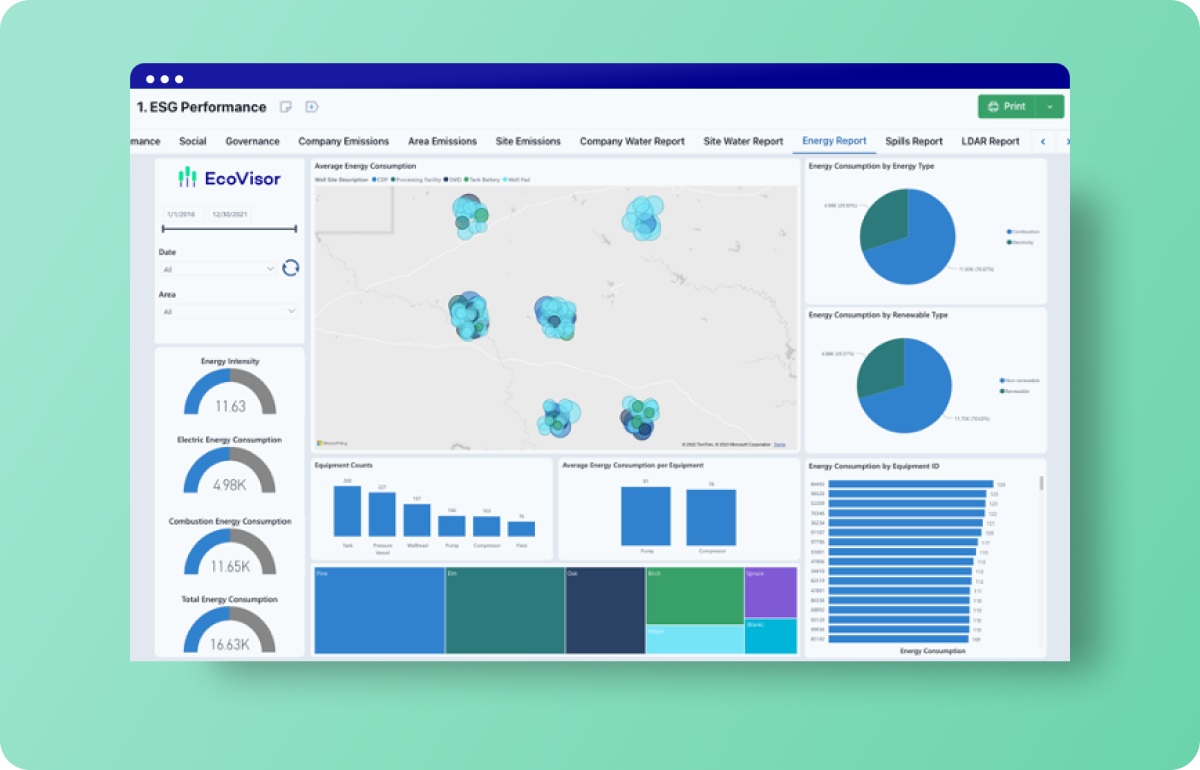
Energy
Report energy consumption by type, site and equipment counts and identify energy saving opportunities.
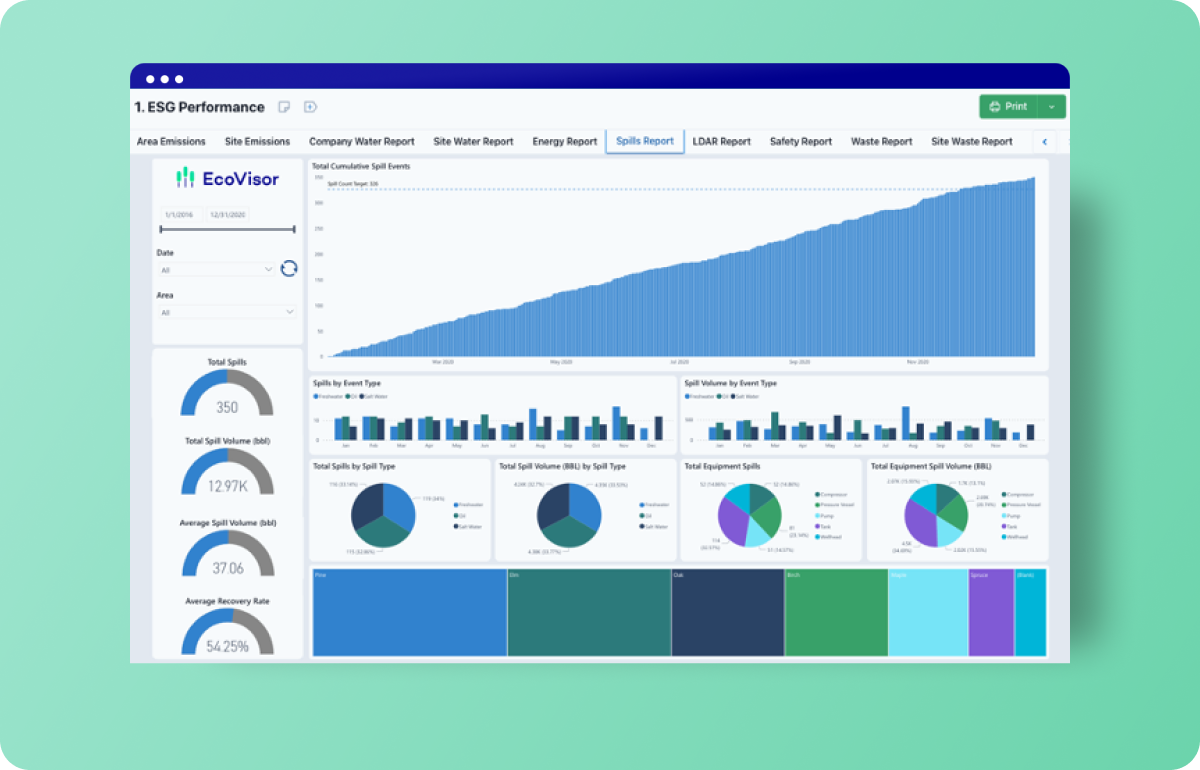
Spills
Review spills by size, type, location, equipment type and average recover rate to assess mitigation strategies.
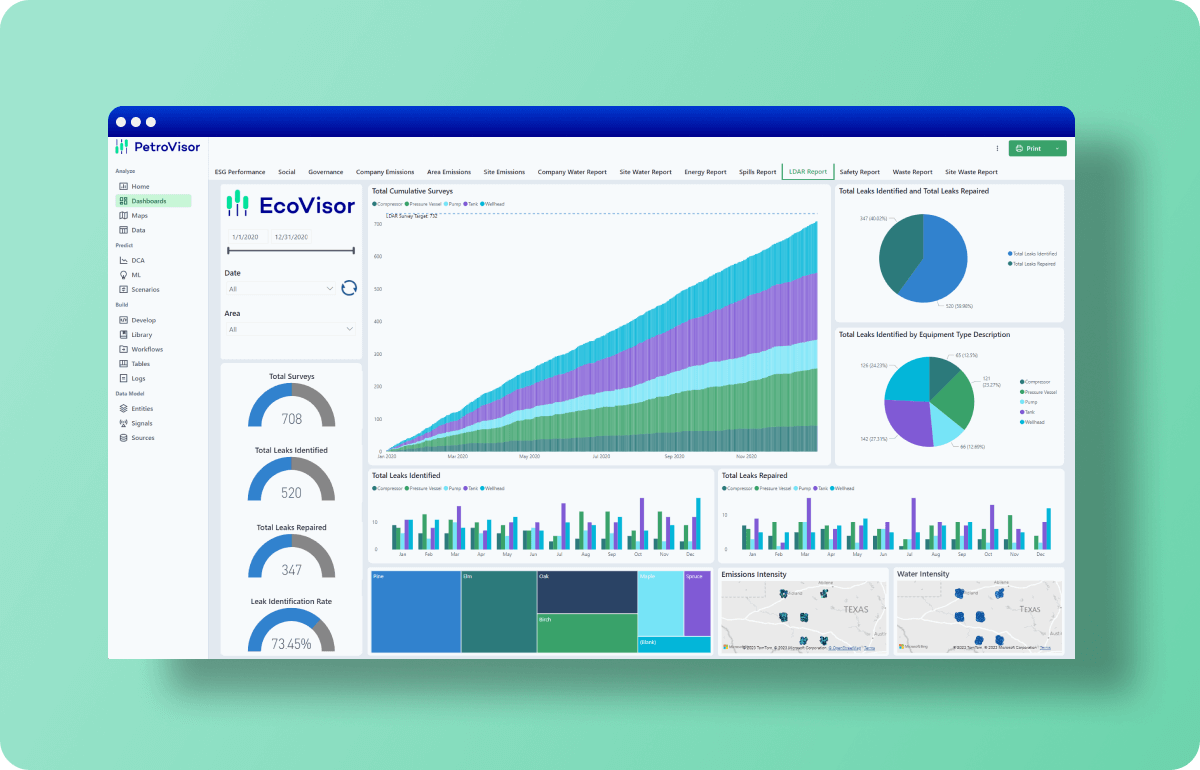
LDAR
Plan and prioritize LDAR program activities with easy oversight and reporting of progress against company goals.
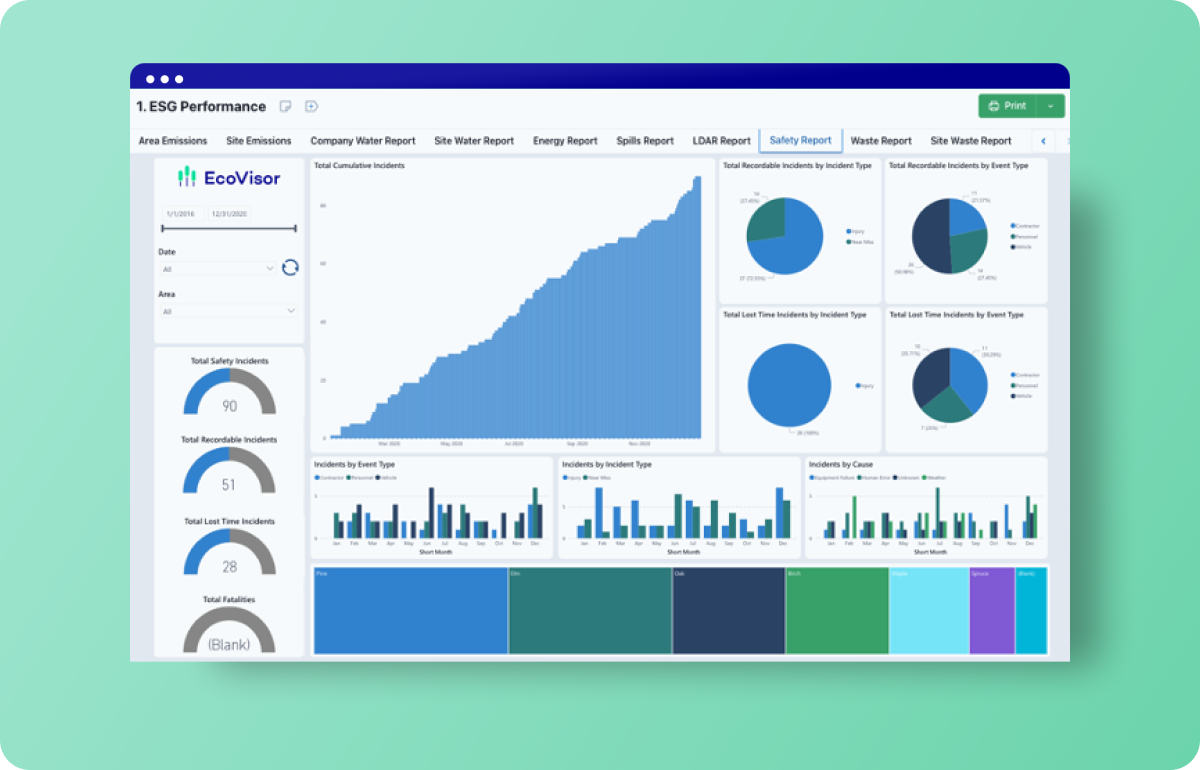
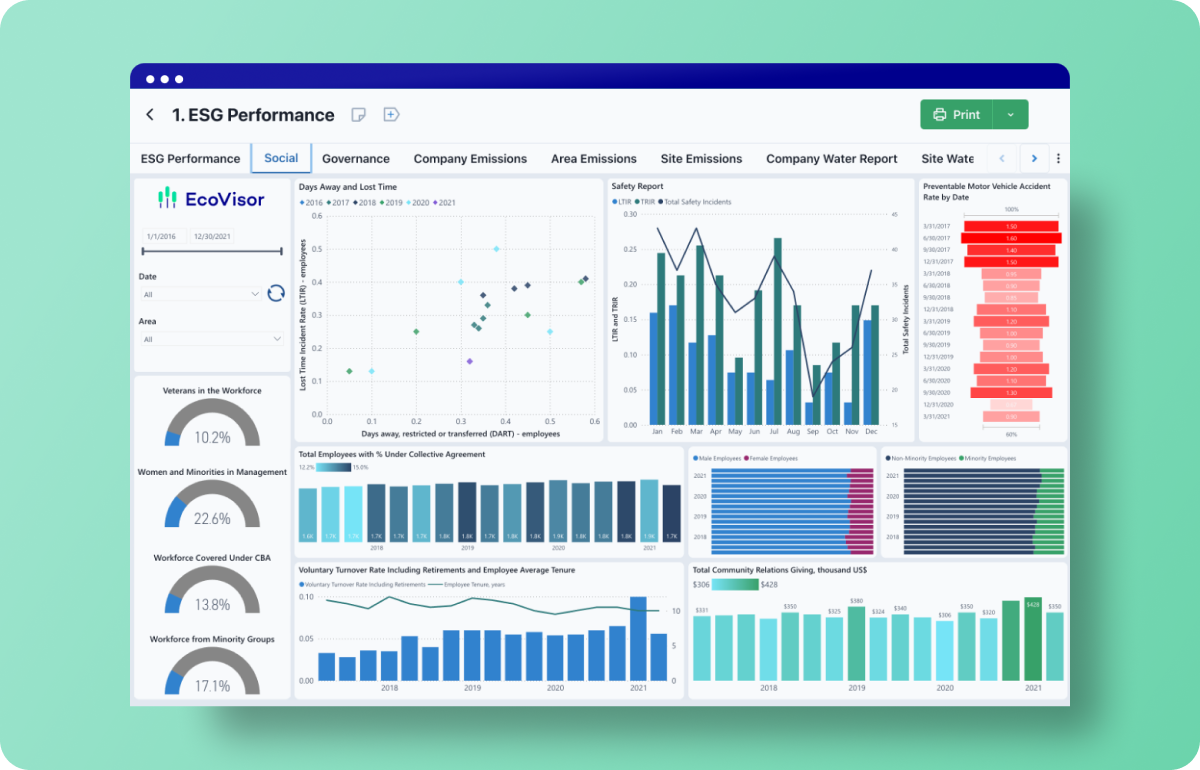
Safety
Track safety improvement initiatives with lost time and recordable incident data by location, type, and cause.
Waste
Report waste by type, hazard category and location including percentage diversion.
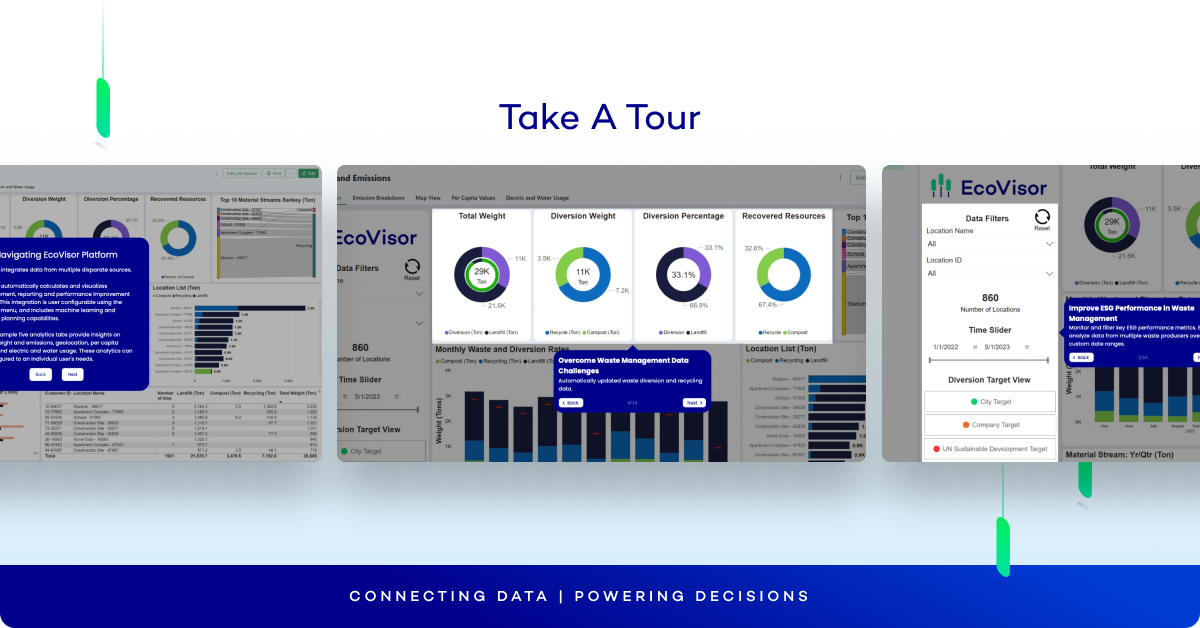
Waste & Diversion Management App
Enabling waste management & environmental service companies.

BROCHURE
Connecting Data to Power ESG Decisions

BLOG
ESG Data In Practice

BROCHURE
EcoVisor Dashboard Reference

Request Info Or Schedule A Platform Tour
Connect with our experts to learn more about the PetroVisor™ and EcoVisor Platforms.